1. What? The theory behind tracking growth and maturity
1.1 The general and individual growth pattern
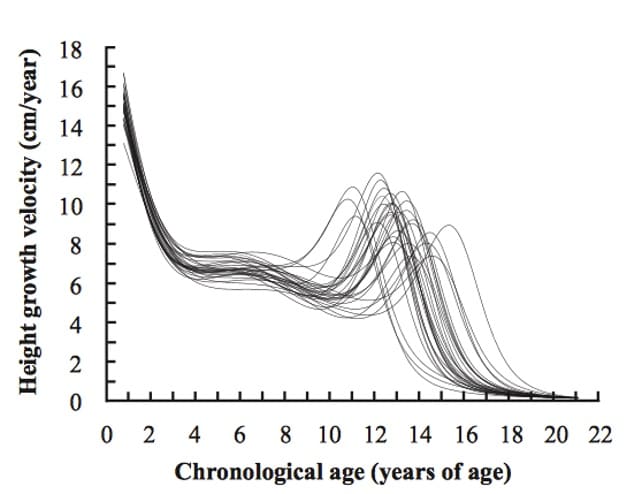
Children and adolescents do not grow at a continuous rate. School-aged children grow at a rate of more or less 6cm/year until they reach puberty, after which they experience a ‘growth spurt’. After reaching 'Peak Height Velocity' (PHV, the moment in their growth spurt when they are growing fastest), growth velocity drops rapidly and the he/she eventually stop growing. This is what is called the general pattern of physical growth (see figure 1).
Figure 1: Average height and growth velocity males and females. The peak in the growth curve is called Peak Height Velocity (PHV)
Although all people follow the same general growth pattern, when individual growth patterns are compared, significant differences in timing and magnitude of the growth spurt can be noted (See figure 2). In other words, some youth athletes might experience a large increase in stature around 12 years old, while others will only experience a smaller growth spurt around the age of 15.
Figure 2: Individual growth patterns of male youth athletes
Consequently, between the ages of 11 and 16 years old, there can be considerable differences in maturity between athletes of the same age, resulting in a large difference in height, weight, and muscle mass. Athletes who have their growth spurt significantly earlier or later than average are referred to as early or late maturers, respectively. Having these early and late maturers train and compete in the same age category can lead to competitive inequity, selection bias, increased injury risk, diverging needs during practice, and differences in psychological and emotional development.
Figure 3: Illustration of the physical difference between late mature and early mature youth athletes. (Faigenbaum et al., 2020)
When talking about the growth spurt of youth athletes, it is important to know the difference between growth and maturation, between maturation status and timing, and between chronological and biological age. :
Growth refers to the increase in size of the body whereas maturation refers to the progress toward the adult or mature state. In sports, the term maturation is often used to refer to the maturation of musculoskeletal system, and is therefore similar to growth. However, note that different systems mature at different rates. For example, a 14 year old early mature athlete might the physical appearance of a 16 year old, but might still have the same psychological maturation state as other 14 year olds.
Maturity status refers to the current state of maturation of the athlete. This is typically measured in pre-PHV, Approaching-PHV, Circa-PHV, and Post-PHV. Maturity timing refers to when the athlete reaches certain developmental milestones (such as PHV), relative to their peers. For example, athletes who reach PHV significantly earlier than their peers are referred to as early maturers.
Chronological age is the age based on calendar date on which the athlete is born (i.e. the ‘actual’ age), whereas biological age reflects how far an individual has progressed through the stages of growth and maturation compared to typical age-related norms. A 14 year old athlete with a biological age of 16 therefore has a body that is at the developmental stage for a typical 16 year old, although he/she has a chronological age of 14. In other words, he/she looks more like a 16 year old rather than a 14 year old.
1.2 How to measure maturation
To take into account the maturation status of youth athletes, you need an accurate and reliable way to measure or estimate it. Below, we briefly describe four methods and discuss their (dis)advantages to apply them on large scale in youth sports.
Perhaps the oldest way to estimate maturation, is by tracking the sexual maturation. As the onset of puberty does not only kickstart the growth spurt but also the development of secondary sex characteristics, the development of pubic hair and breast/testicular tissue can be used to estimate maturation. Evidently this is not an appropriate method to use in an athletic context.
Perhaps the most objective way of measuring maturation is by using skeletal age. Based on a radiograph from the hand and wrist, the development of bones and joint tissues can be compared to reference standards (e.g. Greulich-Pyle or Tanner-Whitehouse) to determine ‘skeletal age’ as a proxy for biological age. Unfortunately, the fact that specialized equipment is needed to make a radiograph makes this method expensive and rather difficult to apply on a larger population. Furthermore, this method only provides insights in maturation, not in growth speed.
Figure 4: Examples of the Greulich-Pyle reference radiographs at different developmental stages.
In search of a method that does not require expensive equipment, the Mirwald equation (maturity offset) was proposed. Knowing that growth takes place in a distal to proximal order (i.e. first hands & feet, followed by legs & arm, and finally the trunk), a formula was proposed to estimate the moment of Peak Height Velocity (PHV) using age, leg length, and stature. Although this method is still being used fairly often, research has shown that there can be considerable errors in the estimation.
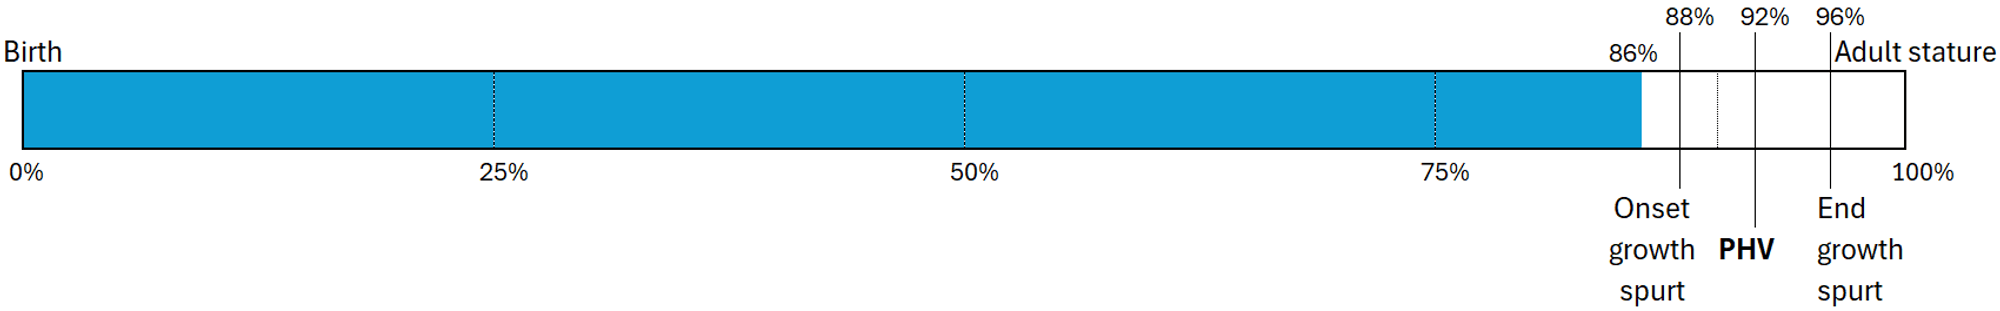
Finally, maturation can be estimated by calculating the Percentage of the Predicted Adult Height (%PAH). This percentage is calculated by comparing the current height of an athlete to that of their predicted adult height (for example calculated using the Khamis-Roche equation). As key events in maturation tend to happen around the same percentage of adult height (e.g. PHV at ±92%PAH), the %PAH can be used as a proxy for biological age. This has been the preferred method in large scale interventions such as in the Elite Player Performance Plan of the English Premier League, and is also the method that is applied in the Hylyght Growth Tracker.
Figure 5: Illustration of tracking maturity using the %PAH method. Knowing that the onset of the growth spurt occurs around 88% of PAH, a youth athlete with a current %PAH of 86% can be expected to start his/her growth spurt soon.
1.3 Gender differences in maturity
Until puberty, the physical development of boys and girls is rather similar. However, the timing and effects of the growth spurt are vastly different
The timing of the growth spurt is about 1,5 year earlier in girls than in boys, and the PHV is - on average - lower. This is why 13 year old girls are often taller than boys of the same age, but most boys will surpass girls in stature by the time they are 14.
Puberty also has a different effect on the body composition of male and female youth athletes. Whereas the increase in mass is mostly due to the increase of lean body mass in boys, this is accompanied by gains in fat mass in girls. Both boys and girls become taller and stronger after the growth spurt, but in contrast to boys, this does not result in improved speed, agility, and relative strength for girls.
Figure 6: Gains in muscle (left) and fat (right) mass in the arms (top) and legs (bottom) for boys (black dots) and girls (open dots).
Changes in body size and composition due to puberty also have a different psychological effect on boys and girls. Whereas being taller and bigger tends to lead to higher self-esteem in boys, the opposite is often the case in girls - although these effects are highly dependent on individual and cultural expectations.
As a result of the different effects of puberty, selection bias also tends to differ based on gender. Whereas early maturing boys are overrepresented in most sports, early maturing girls are only overrepresented in sports where size and strength play a bigger role (e.g. basketball), and are underrepresented in sports that emphasize aesthetic qualities or agility (e.g. figure skating).
Age at Onset Growth Spurt (y)
Age at Peak Height Velocity (years)
Age at Peak Weight Velocity (years)
Peak Height Velocity (#cm/y)
Peak Weight Velocity (#kg/y)
Age at adult Stature (years)
Boys
±12
13.4 ± 1.0
13.8 ± 1.1
10.4 ± 1.2
10.3 ± 1.9
±18
Girls
±10
11.8 ± 0.9
12.3 ± 1.2
8.6 ± 1.1
8.7 ± 1.4
±16
Table 1: The timing of some key milestones in the physical growth of youth athletes (based on Iuliano-Burns et al 2000; Carrascosa et al 2018).
2. Why? The importance of tracking growth of youth athletes
Tracking growth and calculating maturity has multiple benefits for athletes, trainers, and clubs. We briefly summarize the three main benefits below.
2.1. Reduce injury burden
Why is the growth spurt a risk factor for injuries?
At the start, during, and immediately after the growth spurt, youth athletes are more prone for injuries. Two factors contribute to this effect:
On the one hand, during the growth spurt, bones grow earlier than the muscles, tendons, and ligaments, which leads to higher stress on the musculoskeletal system. This results in a reduction of the load capacity of the musculoskeletal system, and increases the chance of experiencing both acute and overuse injuries.
A second factor that contributes to the higher injury rate, is that the rapid increase in height and weight can reduce neuromuscular control and stability. This results in a temporary decrease of coordination and technique, and is often referred to as "adolescent awkwardness".
Unfortunately, this period of increased injury risk often coincides with an increase in intensity of sport-specific training and competition. To make matters worse, early maturing athletes are often labelled as "talented" because they are taller, faster, and stronger than their peers. In the period in which they are most prone for overuse injuries, these athletes are then offered extra training sessions, for example by joining a training session of an older youth team once a week. It is therefore no surprise that multiple studies have reported increased prevalence of in injuries during the period of PHV.
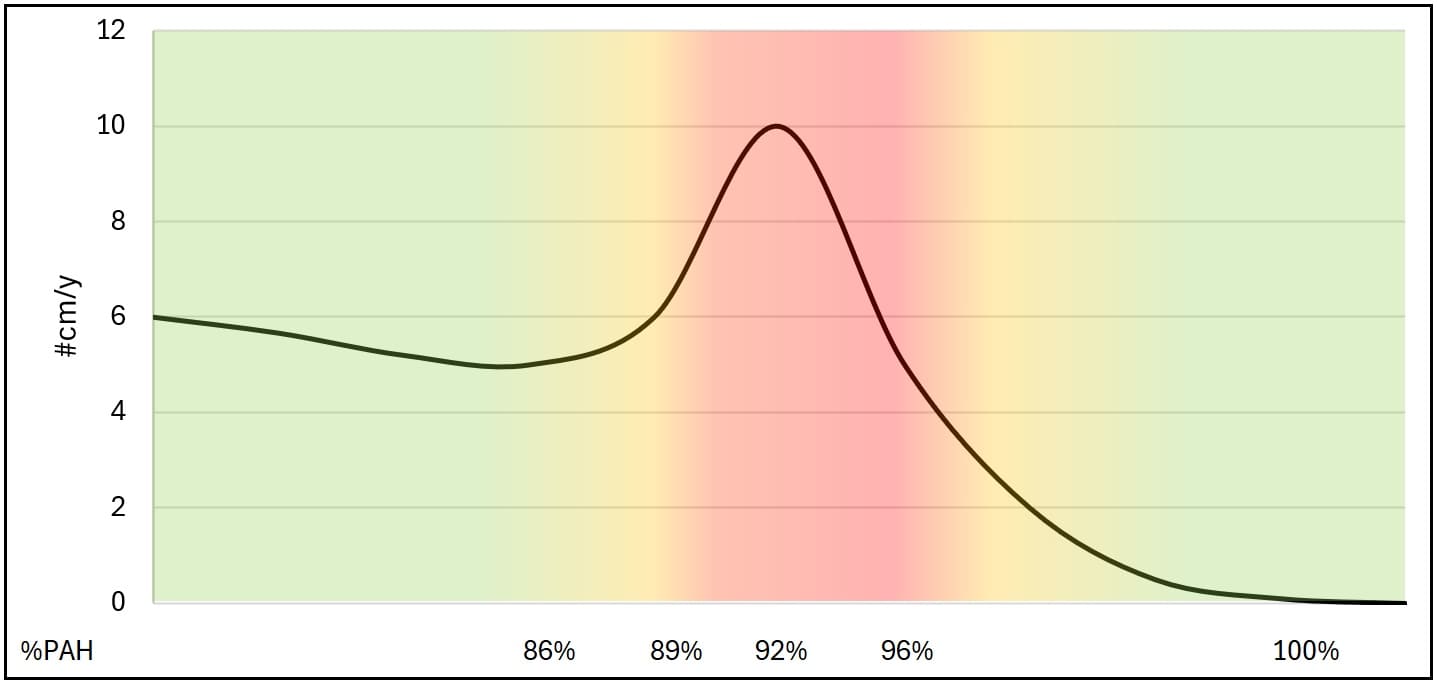
Figure 7: The relation between growth speed and injury likelihood. Red indicates higher likelihood for injury.
Tracking growth gives insight into when a player enters the stages of increased risk, and when growth velocity reaches its peak.
Athletes with increased risk for injuries should be provided with developmentally appropriate training programmes. Exact training content is dependent on sport-specific characteristics, but the general goal is the same for each sport: reduce the training load and modify the training content.
Practical suggestions to reduce injury prevalence in this high-risk group:
Reduce repetitive intensive activities such as sprinting and jumping
More attention to technical and tactical aspects
Focus on balance, mobility, coordination, and core stability
Reduce load by training on cushioned surfaces
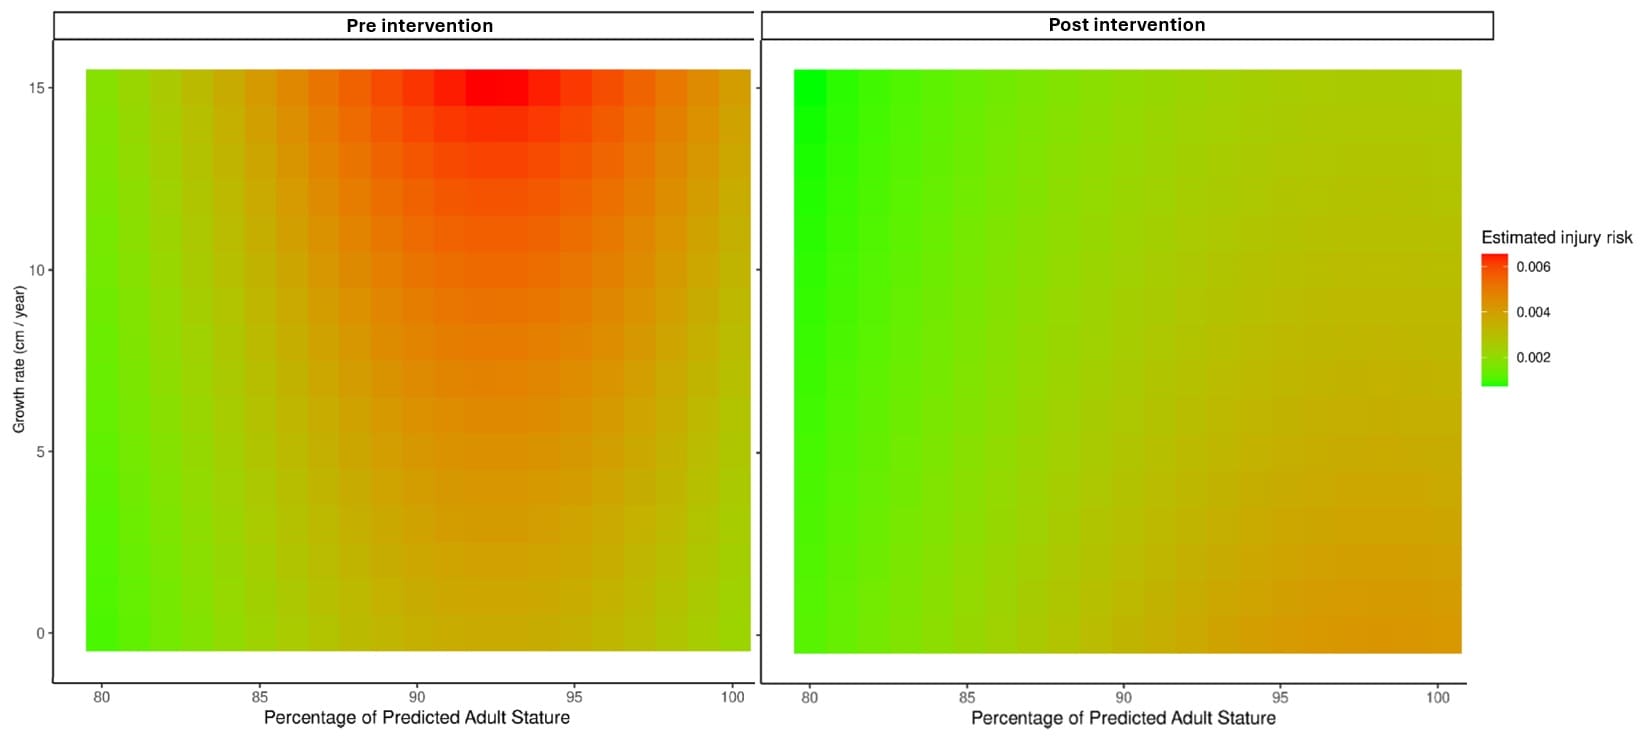
Case study of successful implementation: AFC Bournemouth (Soccer)
By monitoring growth and adjusting training load and content, AFC Bournemouth reported a 86% reduction in injury incidence among players within their growth spurt.
Figure 8: A heat map showing the combined effects of Growth Rate and Percentage of Predicted Adult Stature on estimated injury likelihood in A) 2018–19 season (pre-intervention) and B) 2019–20 season (intervention).
2.2. Improve development of early and late maturers
Why do athletes need a maturation specific training environment?
To ensure optimal development of youth athletes, they could be grouped on the basis of biological rather than chronological age. This practice is called bio-banding, and has multiple benefits.
The considerable differences in size and weight between early and late mature athletes can have safety implications, especially in contact sports such as judo or rugby. Matching youth athletes with opponents of similar size and/or maturity will therefore reduce the risk of some athletes being dangerously overpowered by their peers.
Differences in maturity leads to early maturing athletes to rely too much on their physical strength while disregarding technical and tactical skills Late maturing athletes on the other hand experience less success and might even drop out because of this. Bio-banding has shown to restore the competitive equity. In a bio-banded environment, early maturing athletes need to emphasize technique, teamwork, and tactics over physical power, while late maturing players have the opportunity to demonstrate their skills and take a more active part in the game. Both during practice and competition bio-banding can have a positive effect on the motor development and learning experiences of athletes.
Tracking growth could also be of benefit for the physical development of youth athletes. Athlete development models such as the Long Term Athlete Development Model and the Youth Physical Development model suggest that during certain phases of development, a youth athlete is more responsive to certain training. For example, more intensive strength training in function of hypertrophy is suggested to best take place only after PHV, after 95% of PAH.
Practical suggestion and considerations when implementing bio-banding:
Bio-banding should not replace traditional age categories, but should be used in a complementary way.
When creating bio-banded groups, trainers should also take into account injury history, technical proficiency, and psychological development.
Figure 9: example of a bio-banded team
adapted from YouTube: Bio-Banding Opens More Avenues in Player Development. Link in Youtube
Case study** of successful implementation: Premier League academy (Soccer)
The English Premier League organised a tournament for its academy players who were between 85 and 90% PAH. Interviews with the players revealed that both early and late maturing players described the bio-banded games as a positive and welcome addition to their games program, claimed it was beneficial for their development, and recommended to continue with the initiative.
Reference: Cumming et al., (2018) Premier League academy soccer players’ experiences of competing in a tournament bio-banded for biological maturation
2.3. Better talent detection
Why is maturity important for talent detection and development?
As early maturing athletes are taller, stronger, and faster than their peers, they perform better in competitions, and are over-represented in talent selections. Due to this selection bias, late maturing athletes are often overlooked and receive less opportunities to further develop their talents. In other words, youth academies run the risk of investing in averagely talented early maturing athletes at the cost of more talented late maturing athletes.
Especially when comparing test results of youth athletes, adjusting for maturity might give a completely different image of the athletic profile of the athletes. For example, results in figure 10 shows that this early maturing athlete is outperforming other athletes in his age category, but when compared to athletes of similar maturity status, he is actually underperforming.
Figure 10: Fitness scores for an under 12 athlete, represented as Z-scores relative to players of the same age (left) and relative to players to the same maturity (right; adapted from Cumming et al. 2017)
In many sports, adult height is an important factor to reach the highest level of competition. However, being early or late mature does not correlate with being taller or shorter as an adult. It is therefore important that youth academies take into account predicted adult height when (de)selecting youth athletes and when assigning talented athletes to a certain positions in the team. For example, a talented youth volleyball player with a predicted adult height of 192cm will have better chances to become a professional athlete as a setter than as a middle blocker.
3. How? The benefit of using the Hylyght Growth Tracker
Hylyght helps sports experts in the 3 crucial steps to monitor growth and maturity
3.1. Measure your athletes correctly and efficiently
To monitor the growth and maturity of athletes, height and weight should be measured at least 4x per year (every 3 months). Hylyght facilitates the collection and management of data trough:
Thanks to the Hylyght test app, you can save data directly into the online platform from any device. By providing them with the right link, test leaders can add data to the platform without being able to access data.
Figure 11: Test leaders can add data to the platform without being able to access data.
Advantages:
Direct input to the online platform
Simultaneous testing of multiple groups
Clear overview of athletes
Warning for unlikely values
No more:
Pen and paper measurements
Retyping results into Excel
Combining multiple files
Automated data collection
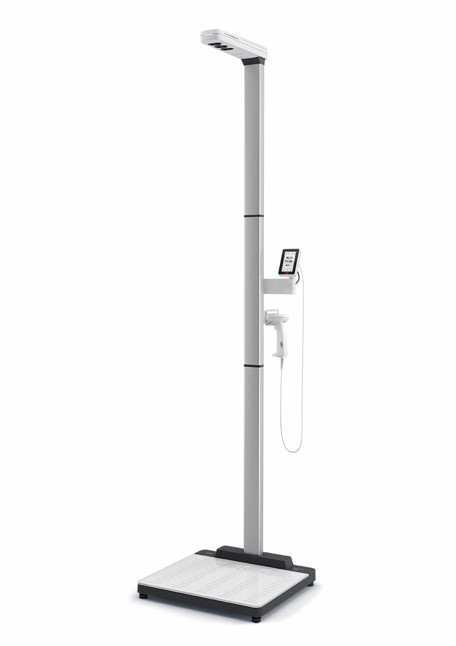
Figure 12: The Seca 286 device, which can be connected to the Hylyght platform to enable automated data collection.
By connecting a Seca 286 device to the Hylyght platform, data collection can be automated.
Advantages:
Fast and accurate
Identification through QR or RFID
No more:
Manual measurement
Inter-rater variability
The online platform
Instead of using elaborate Excel files, use the online platform to safely store and manage all data.
Figure 13: use the online platform to safely store and manage all data.
Advantages
Secure back-up of all data
Easy access management
Scientific analysis
Smooth communication
Fully GDPR proof
No more
Elaborate Excel-files
Asking who has the data file
Searching which is the last version
Struggling with Excel functions
Issues to get information to parents and athletes
3.2. Assess the results according to the newest scientific standards
Data is just a bunch of numbers if you don't give meaning to them.
The Growth Tracker calculates the relevant metrics and highlights important results.
Injury prevention & Bio-banding
Based on scientific literature, the Hylyght platform shows warning signs to indicate which athletes currently experience an increased risk for injuries.
The Hylyght Growth Tracker provides the maturity status of each athlete, and allows to sort them based on biological age or %PAH. This way the growth tracker facilitates the implementation of bio-banding.
Figure 14: Hylyght growth tracker result page (showing mock data)
Talent detection
In case the club also monitors physical fitness, results can be compared to benchmarks specific to the biological age of the athletes, which is essential for talent identification in adolescent athletes.
Figure 15: Results of two physical test, with benchmarks specific for the biological age of the athletes (mock data)
3.3. Guide your athletes using clear individual and team reports
Team reports
Team reports can be downloaded as a pdf and sent to the coaches.
These reports provide a quick and easy overview for the coaches about the athletes in their team.
The maturity report allows for easy bio-banding, and maturity specific training sessions, while the injury risk report indicates which athletes currently experience a growth spurt and therefore have an increased risk for growth-related injuries.
Figure 16: Maturity Report (left) and Injury Risk Report (right). PDF's generated by Hylyght.
Individual reports
In case the club want to provide insights to the players and their parents as well, individual reports can also be downloaded as a pdf, or shared directly from the platform with athletes and parents.
This report informs the athlete about his/her growth velocity and maturity timing.
Figure 17: The Athlete Report informs the athlete about theirs growth velocity and maturity timing
3.4. Webinars and workshops
Finally, to stay up-to-date with the latest scientific findings on how to deal with growth and maturity, we also provide webinars and workshops for staff, athletes, and/or parents.
Young athletes mature at different speeds during puberty. By tracking their growth you can reduce growth related injuries and adapt training programs based on maturity status.
€8
per athlete per year (minimum 50 athletes)
Perfect for everyone working with adolescent athletes
Growth velocity - how fast are your athletes growing
Development - are your athletes early, on time, or late mature
 Show all articles on the knowledge base with the filter:
Tracking Growth
Show all articles on the knowledge base with the filter:
Tracking Growth