How to interpet the Growth Tracker output
 Show all articles on the knowledge base with the filter:
Tracking Growth
Show all articles on the knowledge base with the filter:
Tracking Growth
Reading Time: +/- 8 mins
Table of Contents:
For a general introduction of the theory behind the Hylyght Growth Tracker, see Tracking Growth and Maturity: What It Is, Why It Matters, and How to Do It Right, or watch one of our webinars.
1. The output variables
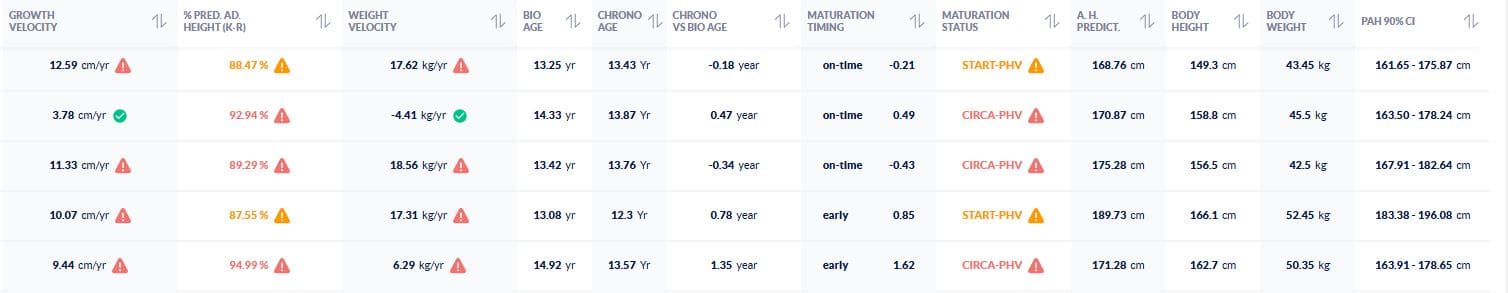
Chrono age (chronological age) is the athlete’s age in years at the time of the last measurement. When the last measurement was taken more than 10 weeks ago, all results of this athlete will be ‘greyed out’ and a red exclamation mark is shown next to his/her name.
Bio age (biological age) is an estimation of the athlete’s maturity level based on physical development rather than their chronological age. This measure is calculated based on the %PAH.
Chrono vs. bio age is the difference between chronological and biological age.
Maturity timing is whether an athlete is considered early, average, or late mature. In the Hylyght platform an athlete is considered early or late if the Z-score for maturation timing is larger than +0.5, or smaller than -0.5, respectively. Using these values, on average 30% of athletes will be considered early mature, 30% will be considered late mature, and 40% will be considered ‘on time’.
Body height is the height (in cm) of the athlete at the time of the last measurement. Clicking on this value will show a graph with the development of the athlete’s body height throughout the last measurements.
Adult H. Predict. is a prediction of the final adult height for this athlete. It is predicted based on current height, weight, age, gender, and height of both parents. Note that the estimation still has an error margin of about 5cm. It is possible that this prediction changes as the athlete grows taller and older.
%PAH (K-R) is the Percentage of the Predicted Adult Height at the time of the last measurement. In other words, the percentage shows how tall the athlete is now compared to the prediction of how tall he/she will become. For example, if an athlete has a predicted adult height of 200cm, and was measured at 180cm, the %PAH will be 90% (180cm / 200cm). This is a proxy for biological age. Sorting the athletes based on their %PAH facilitates the creation of bio-banded groups for practices or tournaments. Growth-related injury risk related to the %PAH is visualised with icons and colours:
- A green ‘v’ is shown when the athlete is still before or already after his/her growth spurt (below 86% or above 95%, respectively). These stages of maturity are generally not associated with increased growth-related injury risk
- An orange ‘v’ is shown when the athlete is approaching his/her growth spurt. This phase is not yet associated with increased injury risk, but growth velocity should be monitored more closely to detect the start of the growth spurt.
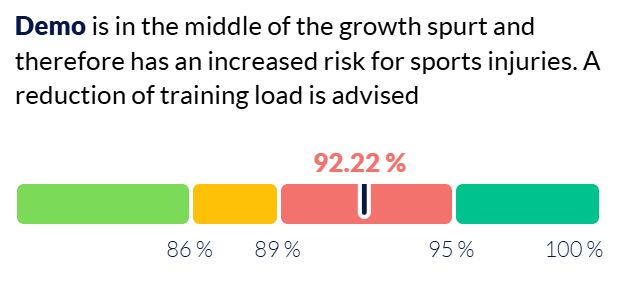
- A red exclamation mark is shown when the athlete is between 89 and 95% PAH, and indicates that the athlete is currently in his/her growth spurt. This period is associated with an increased risk of growth-related injuries. Coaches should adapt the training program of these athletes to reduce training load and increase load capacity (see next section) Clicking on this value will show a graph depicting the %PAH together with the maturation status. Typically, the onset of the growth spurt is around 89%, the Peak Height Velocity (PHV) around 92%, and the end of the growth spurt around 95%.
Maturation status of the athlete at the time of the last measurement. Similar to %PAH, it is shown in green when the athlete is pre or post PHV, in orange when approaching PHV (‘start-PHV’) and red when the athlete is circa-PHV.
Growth Velocity is how fast the athletes were growing between the last two moments of measurement, expressed in number of centimetres per year. Growth-related injury risk related to this growth velocity is visualised with the icon next to the value.
- A green ‘v’ is shown when growth velocity is below 6cm/year. This is not associated with increased risk for growth-related injuries.
- An orange ‘v’ is shown when growth velocity is between 6 and 8 cm/year. This indicates a slightly higher growth velocity and might come with higher risk for growth-related injuries.
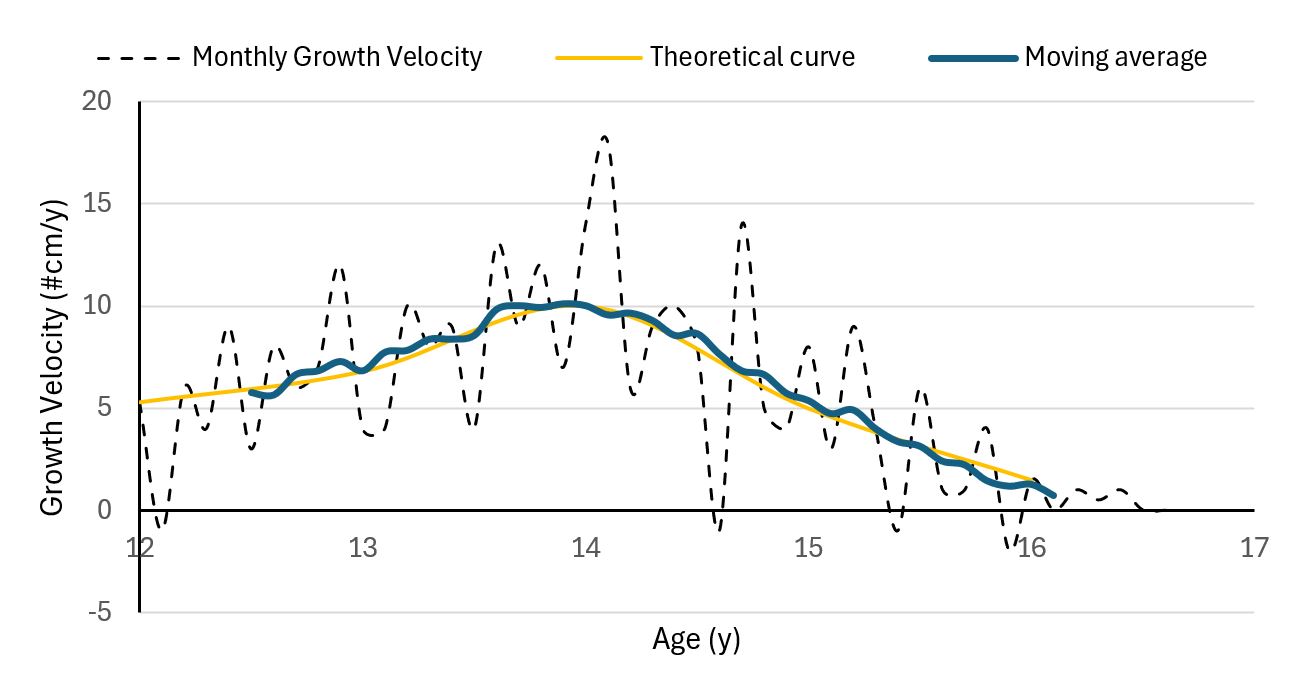
- A red exclamation symbol is shown when growth velocity is higher than 8 cm/year. Above this growth velocity the athlete has a significantly higher chance to experience growth-related injuries. Clicking on this value will show a graph of the growth velocity curve. Note: While the average trajectory of human growth is gradual, individual growth is often saltatory, characterised by short bursts of rapid growth. When an athlete is measured monthly or even more often, their graph might show large variations from one measurement to another (see figure 3).
Body Weight is the weight (in kg) of the athlete at the time of the last measurement. Clicking on this value will show a graph with the development of the athlete’s body weight throughout the last measurements.
Weight Velocity is how fast the athlete has been gaining weight between the last two moments of measurement. Clicking on this value will show a graph with the development of the athlete’s body weight velocity throughout the last measurements. Note that this value can fluctuate greatly depending on when the athlete was weighed (e.g., before or after lunch). Peak Weight Velocity occurs about half a year after Peak Height Velocity and reaches, on average, 8 kg/year in girls and 10 kg/year in boys. Higher weight velocity is believed to be associated with higher injury risk as it increases stress on the musculoskeletal system. However, so far, this has not been backed by clear scientific evidence.
PAH 90% is the 90% confidence interval of the adult height prediction. This means that 90% of athletes will have a final height that is between the two values in this column.
2. Avoiding growth-related injuries
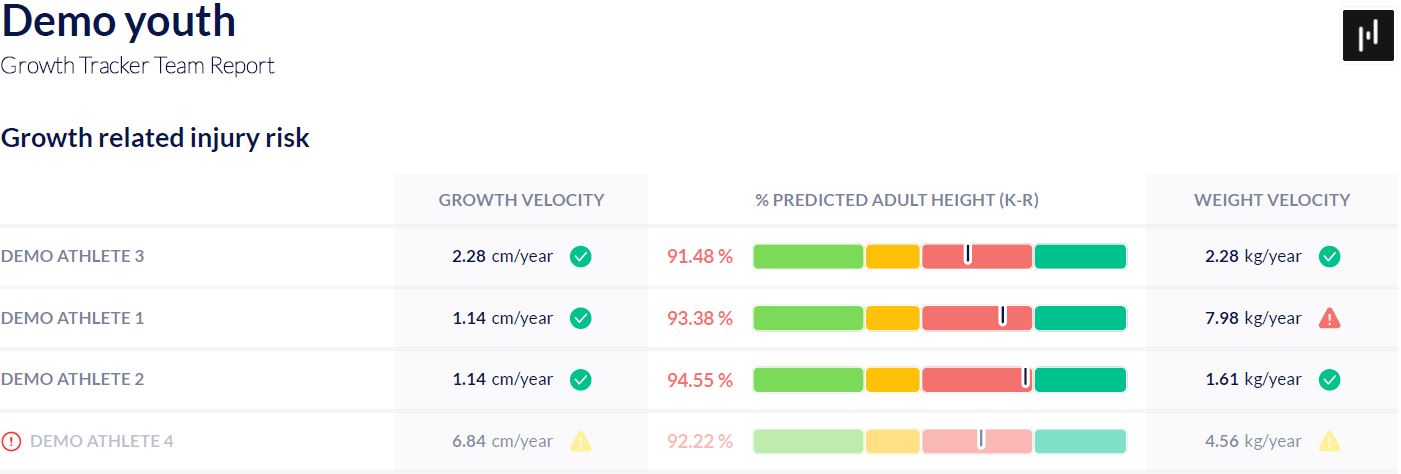
Scientific studies have linked growth velocity (above 7.2cm/year) and the athlete’s maturation status (circa-PHV; between 89 and 95% of PAH) to an increased risk for injuries. In the group report of the Growth Tracker, these two measures are conveniently summarized for each athlete of the team. To find out how to download this report, see (the practical guide of the Growth Tracker).
Trainers and coaches are strongly advised to reduce the training load for athletes who are in the ‘danger zone’ for one or both of these measures. In general, this can be accomplished through:
- Reduce the number of training hours (usually only necessary when the athlete has a history of injuries or if he/she is growing exceptionally fast)
- A reduction of repetitive intensive activities (e.g., jumping and sprinting)
- Reducing load by training on cushioned surfaces
- Focus on technical and tactical aspects instead of physical development
At the same time, it is advised to increase the load capacity of these athletes by providing additional exercises for:
- Balance and proprioception: Helps to stabilize muscles around the joints and reduces the risk of falling.
- Mobility and flexibility: Reduces excessive tension on muscles, tendons and the growth plates, which in turn reduces the risk of strains.
- Coordination: Reduces strain on the body due to inefficient movements and helps to overcome the adolescent awkwardness
- Core stability: Reduce stress on the lower back and improve overall stability
- Sport specific injury prevention
Higher weight velocity is believed to be associated with higher injury risk as it increases stress on the musculoskeletal system. However, so far, this has not been backed by clear scientific evidence. Adjusting the training load to the growth velocity and maturity status is currently considered best practice.
3. Implementing bio-banding
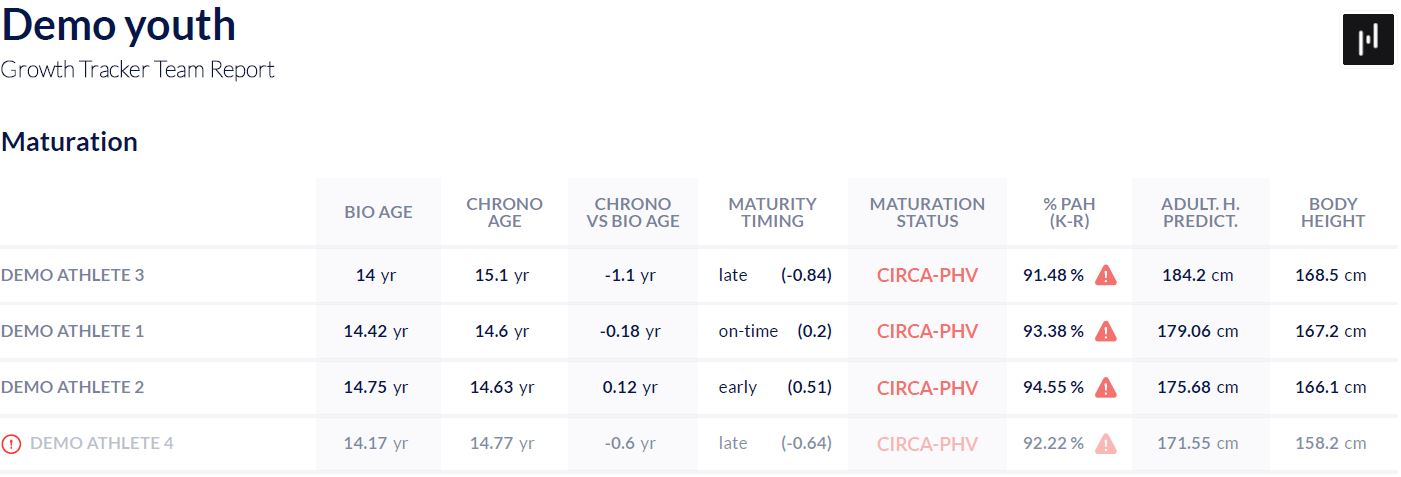
The group report of the Growth Tracker also facilitates the implementation of bio-banding. The Maturation section of this report shows all athletes in one group, ordered according to their biological age. Trainers and coaches can use this information to regroup athletes in bio-banded teams for practices or tournaments.
Keep in mind that bio-banding should not replace age categories. The athlete’s mental development and technical proficiency should also be taken into account when creating new groups.
⤶ Back to the Growth Knowledge Base